Money Hammer Chicago, Illinois


If you like Money Hammer, you may also like:

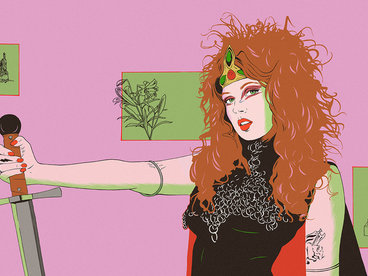
The metal’s band revelatory new record crosses genres and styles, effortlessly combining seemingly incompatible subgenres.
go to album
featured on Bandcamp Radio Apr 26, 2024
go to album
Wretched Blessing
by Wretched Blessing
featured on Bandcamp Radio Apr 26, 2024
go to album
featured on Bandcamp Radio Apr 26, 2024
go to album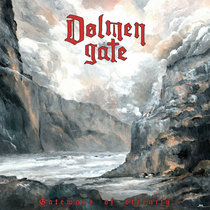
Gateways of Eternity
by Dolmen Gate
featured on Bandcamp Radio Apr 26, 2024
go to album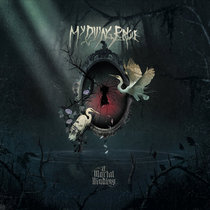
A Mortal Binding
by My Dying Bride
featured on Bandcamp Radio Apr 26, 2024
go to album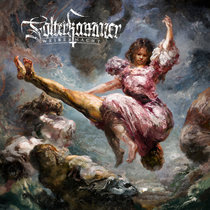
featured on Bandcamp Radio Apr 26, 2024
go to album